Linear Support Vector Machines
Introduction
A Support Vector Machine (SVM for short) is another machine learning algorithm that is used to classify data. The point of SVM’s are to try and find a line or hyperplane to divide a dimensional space which best classifies the data points. If we were trying to divide two classes A and B, we would try to best separate the two classes with a line. On one side of the line/hyperplane would be data from class A and on the other side would be from class B. This alogorithm is very useful in classifying because we must to calculate the best line or hyperplane once and any new data points can easily be classified just by seeing which side of the line they fall on. This contrasts with the k-nearest neighbors algortihm, where we would have to calculate each data points nearest neighbors.
Hyperplane
A hyperplane depends on the space it is in, but it divides the space into two disconnected parts. For example, 1-dimensional space would just be a point, 2-d space a line, 3-d space a plane, and so on.
How do we find the best hyperplane/line?
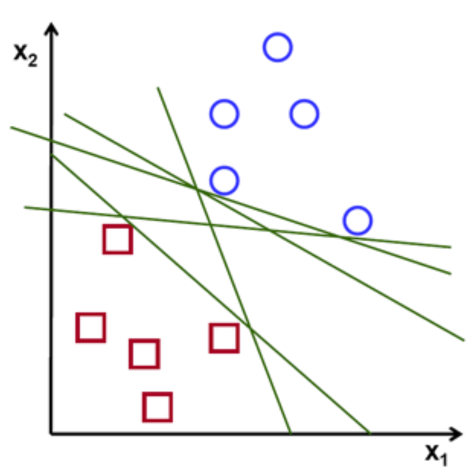
You might be wondering that there could be multiple lines that split the data well. In fact, there is an infinite amount of lines that can divide two classes. As you can see in the graph below, every line splits the squares and the circles, so which one do we choose?
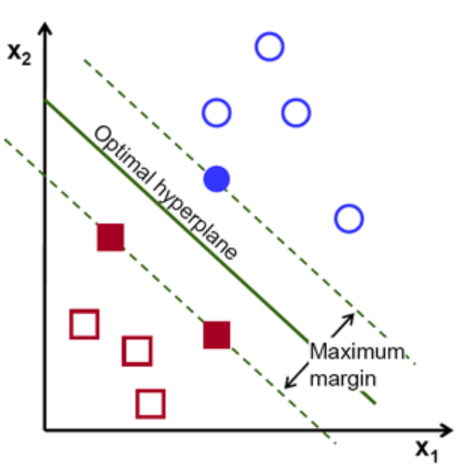
So how does SVM find the ideal line to separate the two classes? It doesn’t just pick a random one. The algorithm chooses the line/hyperplane with the maximum margin. Maximizing the margin will give us the optimal line to classify the data. This is shown in the figure below.
How to maximize the margin?
The data that is closest to the line is what determines the optimal line. These data points are called support vectors. They are shown as the filled in squares and circles above. The distance from these vectors to the hyperplane is called the margin. In general, the further those points are from the hyperplane, the greater the probability of correctly classifying the data. There is a lot of complex math that goes into finding the support vectors and maximizing the margin. We won’t go into that; we just want to get the basic idea behind SVMs.
Ignore Outliers
Sometimes data classes will have outliers. These are data points that are clearly separated from the rest of their class. Support Vector Machines will ignore these outliers. This is shown in the figure below.
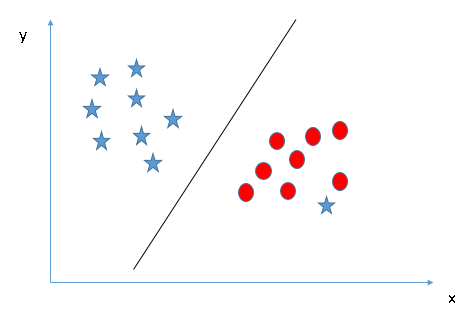
The star that is with the red circles is the outlier. So, the SVM ignores the outlier and creates the best line to separate the two classes.
Kernel SVM
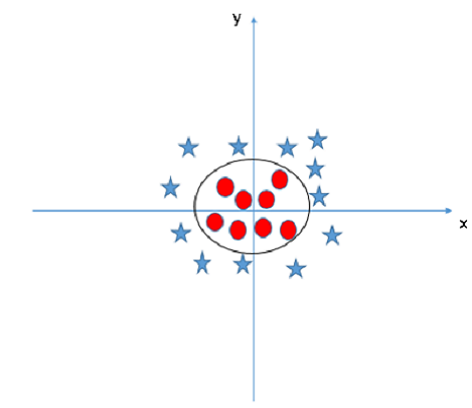
There will be data classes that can’t be separated with a simple line or hyperplane. This is called non-linearly separable data. Here is an example of that kind of data.
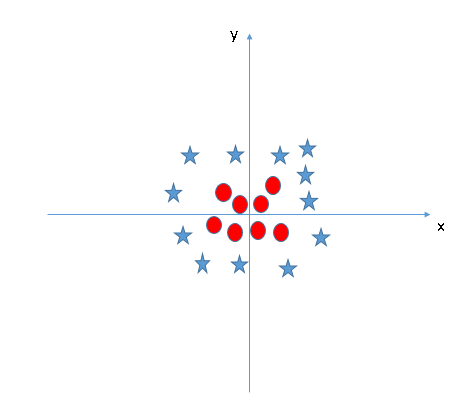
There is no clear way to separate the stars from the circles. SVMs will be able to classify non-linearly separable data by using a trick called the kernel trick. Basically, the kernel trick takes the points to a higher dimension to turn non-linearly separable data to linear separable data. So the above figure would be classified with a circle that separates the data.
Here is an example of the kernel trick.
There are three types of kernels:
- Linear Kernel
- Polynomial Kernel
- Radial Basis Function (RBF) kernel
You can see how these kernels change the outcome of the optimal hyperplane by changing the value of kernel in “model = svm.SVC(kernel = ‘linear’, C = 10000)” to either ‘poly’ or ‘rbf’. This is in the linear_svm.py.
Conclusion
An SVM is a great machine learning technique to classify data. Now that we know a little about SVM’s we can show the advantages and disadvantages to using this classifier.
The pros to SVM’s:
- Effective in classifying higher dimensional space
- Saves space on memory because it only uses the support vectors to create the optimal line.
- Best classifier when data points are separable
The cons to SVM’s:
- Performs poorly when there is a large data set, the training times are longer.
- Performs badly when the classes are overlapping, i.e. non-separable data points.
Motivation
Why would you ever use SVMs? There are so many different models that can classify data. Why use this one? This is probably the best classifier if you know the data points are easily separable. Also, it can be extended by using kernel tricks, so try using the different kernels like Radial Basis Function (RBF).
Code Example
Check out our code, linear_svm.py to learn how to implement a linear SVM using Python’s Scikit-learn library. More information about Scikit-Learn can be found here.
linear_svm.py, Classifies a set of data on breast cancer, loaded from Scikit-Learn’s dataset library. The program will take the data and plot them on a graph, then use the SVM to create a hyperplane to separate the data. It also circles the support vectors that determine the hyperplane. The output should look like this:
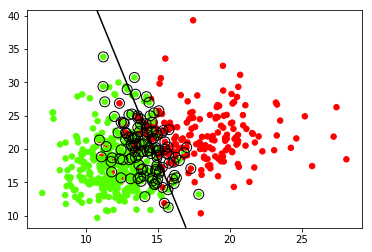
The green points are classified as benign. The red points are classified as malignant.
This loads the data from the Scikit-Learn’s dataset library. You can change the data to whatever you would like. Just make sure you have, data points and an array of targets to classify those data points.
dataCancer = load_breast_cancer()
data = dataCancer.data[:, :2]
target = dataCancer.target
You can also change the kernel to ‘rbf’ or ‘polynomial’. This will create a different hyperplane to classify the data. You can change it here in the code:
model = svm.SVC(kernel = 'linear', C = 10000)
model.fit(data, target)
References
- https://www.analyticsvidhya.com/blog/2017/09/understaing-support-vector-machine-example-code/
- https://stackabuse.com/implementing-svm-and-kernel-svm-with-pythons-scikit-learn/
- https://towardsdatascience.com/support-vector-machine-introduction-to-machine-learning-algorithms-934a444fca47
- https://towardsdatascience.com/https-medium-com-pupalerushikesh-svm-f4b42800e989
- https://towardsdatascience.com/support-vector-machines-svm-c9ef22815589